

Mastering Analyzer – The six numbers behind every finished record

Mastering Analyzer
AICreativa.mk
WAV · AIFF/AIFC · FLAC · MP3 · OGG · M4A — full-track offline analysis, BS.1770-4 K-weighted. AIFF is decoded here in the page, because browsers other than Safari do not read it. Nothing is uploaded; everything runs in your browser.
100
Sens
View
Integrated loudness—
—LUFS
Short —Moment —
True peak—
—dBTP
Ceiling −1.0Sample —
Dynamics · PSR—
—LU
PLR ——
Loudness range—
—LU
Crest — dB
Stereo field—
—width
Corr —Bal —
Signal quality—
—overs
DC —Run —
Professional targetsReference
Integrated loudness−9…−13 club/DJ · −16 hi-fi & Apple · −14 streaming · −9 CD
True peak−0.1 dBTP for WAV masters & distributors · −1.0 dBTP when delivering straight to lossy platforms · never 0
Dynamics · PSRPSR ≥ 8 in the loudest parts · DR 8–14 (12+ audiophile)
Loudness range3–5 LU club · 5–9 LU pop/electronic · 9–15 LU dynamic
Stereo fieldCorrelation +0.5…+1 · bass kept mono · balance centred
Signal quality0 overs · no clipping · DC offset below −60 dBFS
Loudness over time
Short-term
Integrated
Target
Frequency balance
20Hz100Hz500Hz2kHz8kHz20kHz
Bass <250
—
Mid 250–4k
—
Treble >4k
—
Vectorscope—
Correlation
—
Width
—
Mono compatibility by band
—
How much of each band survives a mono fold-down, and how correlated the two channels are there. Sub and bass should read close to 0 dB loss — anything below −3 dB disappears on a club rig.
Mastering recommendations
Load a file and press Analyze.
Mastering guide — what matters most
▾
Numbers guide you, but ears decide. Use the meters to catch problems — then trust these principles, in roughly this order.
1 · Start from a clean mix
Mastering can't rescue a broken mix. Deliver with 3–6 dB of headroom on the bus and no clipping. If it's already slammed, fix the mix first — that outweighs every plugin in the chain.
2 · Loudness is a target, not a trophy
Match the delivery target. Streaming normalises everything to the same loudness, so over-compressing just to be loud costs dynamics and wins nothing. Aim, don't crush.
3 · Protect the true peak
For a WAV master going to a distributor, −0.1 dBTP is the accepted ceiling. Leave more — around −1.0 dBTP — only when you deliver straight to a lossy platform, because inter-sample peaks can clip after MP3/AAC encoding. Sample-peak metering alone will miss them either way.
4 · Guard the dynamics
Loudness range is the life of the master. Over-limiting flattens transients until everything feels the same size. Keep PSR ≥ 8 in the loudest sections and watch the DR figure — the best masters still breathe.
5 · Balance by tilt, not by numbers
Low frequencies always carry most of the raw energy, so a high bass percentage is normal — judge tone by the slope of the spectrum. Aim for a smooth downward tilt, and A/B against references you trust.
6 · Keep the low end mono
Sub and bass should sit centred and mono-compatible. Anything pulling negative in correlation disappears on club rigs and phone speakers. Widen the top, anchor the bottom.
7 · Reference at matched loudness
Louder always sounds better for the first few seconds — that's the ear, not the master. Level-match to a commercial reference at the same LUFS before you decide anything.
8 · Translate everywhere
Master at a moderate monitoring level, take breaks, and check on monitors, headphones, phone and car. If it only works loud on your monitors, it isn't finished.
Mastering Analyzer · AICreativa.mk
SR Keys · SR-303 · SR Rhythm · NY 606
Reading a master: what the numbers actually tell you
There is a moment every producer knows. The mix is finished. The arrangement works, the groove sits, the low end moves the way it should. And then comes the question that has no obvious answer: is it ready?
Mastering is where that question gets settled. It is the last creative decision and the first technical one — the stage where a piece of music stops being a project file and becomes a record that has to hold up on a club system, a car stereo, a pair of cheap earbuds, and a mastering-grade monitor chain, all without falling apart.
What follows is a working guide to the measurements that matter, why they matter, and how to read them together rather than in isolation.
Mastering is not “making it loud”
The most persistent myth in modern production is that mastering means turning everything up. It doesn’t, and hasn’t for years.
Every major streaming platform normalises playback loudness. Spotify, YouTube, Tidal and Amazon play back at roughly −14 LUFS. Apple Music sits lower, around −16. If you deliver a master crushed to −7, the platform simply turns it down — and what the listener hears is not a louder track, but a flatter one. You paid for the extra decibels with your transients, and you got nothing back.
Loudness is a delivery target, not an achievement. The real work of mastering is elsewhere: balance, translation, headroom, and control.
The six measurements that matter
1. Integrated Loudness (LUFS)
This is the perceived loudness of the whole track, measured with a frequency weighting that approximates how human hearing actually works. It is the single number platforms use to decide how much to turn you up or down.
Targets differ by destination: around −6 to −8 LUFS for club and DJ playout, −14 for most streaming, −16 for Apple Music and hi-fi listening, −9 for CD, −23 for broadcast. Pick your target before you start, not after.
2. True Peak (dBTP)
Your DAW’s peak meter measures samples. But when a file is converted to MP3 or AAC, the decoder reconstructs a continuous waveform between those samples — and that reconstructed wave can rise above the highest sample. This is inter-sample clipping, and it is why a master that reads a comfortable −0.1 dBFS can distort on a listener’s phone.
True peak metering catches it. Keep your ceiling at −1.0 dBTP for streaming, −0.3 dBTP for CD and club delivery. Never print a master that touches zero.
3. Dynamics: PSR and DR
PSR (Peak-to-Short-term Ratio) measures how much headroom remains above the loudest sections. It is the most honest indicator of over-limiting available, because it looks at the moments where limiting actually happens. Aim for PSR of 8 or higher in the loudest passages. Below that, you are trading transient life for level.
DR is the familiar single-number dynamic range figure. Most well-made records land somewhere between DR8 and DR14, with audiophile releases sitting at 12 and above.
Dynamics are not a technical formality. They are the difference between a kick that hits and a kick that merely occurs.
4. Loudness Range (LRA)
Where PSR describes the loudest moments, LRA describes the whole arc — how much the perceived loudness varies from the quietest passage to the loudest. A tightly controlled club track will sit around 3 to 5 LU. Most pop and electronic material lands between 5 and 9. Dynamic, arrangement-driven music can run 9 to 15.
There is no correct value, only a value appropriate to the music. But a track with an LRA of 1 has almost certainly been flattened, whatever the genre.
5. Stereo Field
Two numbers tell most of the story. Correlation describes how much the left and right channels agree: +1 is perfect mono, 0 is fully decorrelated, and negative values mean the channels are actively cancelling. Anything below zero will lose energy — or disappear entirely — when the signal is summed to mono, which happens more often than producers expect: club systems, phone speakers, some broadcast chains.
Width quantifies how much energy sits in the side channel relative to the mid. Wide is good until it isn’t. The reliable rule: widen the top, anchor the bottom. Sub and bass should stay centred and mono-compatible, because low frequencies carry the most energy and have the least directional information for a listener to use.
A vectorscope makes this visible instantly. A vertical shape means mono. A balanced ellipse leaning vertical is a healthy stereo master. A shape spreading horizontally is a phase problem waiting to happen on a club rig.
6. Signal Quality
The unglamorous checks that catch real damage: clipped samples, DC offset, channel imbalance. A master should contain zero samples at full scale. DC offset — a constant voltage bias that shifts the waveform off centre — silently steals headroom and can cause audible clicks at edit points. A high-pass filter around 20 to 30 Hz removes it.
These are the errors that get caught at the pressing plant, or worse, by a listener.
Reading them together
No single number decides anything. The skill is in the relationships.
A track at −8 LUFS with a PSR of 5 has been limited hard. The same loudness with a PSR of 9 means the mix arrived with enough headroom that limiting barely had to work — a fundamentally different, and better, record.
A correlation of +0.95 looks excellent, but paired with a width figure near zero it may simply mean the master is nearly mono. Context decides.
And tonal balance is the parameter most often misread. Low frequencies always carry the majority of a track’s raw energy — a bass reading of 80% is normal, not a fault. What matters is the slope: a smooth downward tilt of roughly −3 dB per octave from lows to highs, which is the spectral shape of pink noise and, not coincidentally, the shape most naturally balanced music tends toward. Judge the curve, not the percentage.
Analyse your own masters
We built a free browser-based mastering analyser that measures all of this on your own files — no upload, no account, nothing leaves your computer. It reads WAV, AIFF, FLAC, MP3, OGG and M4A.
How to use it
1. Load your track. Drop in a file, or paste a direct audio URL. The track name stays visible at the top so you always know what you’re looking at.
2. Pick your destination. The selector at the top right sets the target the analysis is judged against — Club/DJ, HiFi/Home listening, Spotify/YouTube/Tidal/Amazon, Apple Music, Deezer, CD, broadcast, or a custom LUFS value of your own. Choosing the right target matters: a master that reads “too loud” for streaming may be exactly right for a club system.
3. Press Analyze. The full track is measured offline — integrated loudness, true peak, PSR, DR, loudness range, stereo correlation and width, clipping and DC offset. Six meters fill in, each with a status badge, and a reference card lists the professional target values beside them.
4. Read the spectrum and vectorscope. Below the meters, the Frequency Balance display shows the averaged spectrum of the whole track with a target range overlay — a −3 dB/octave tolerance zone. If your curve wanders outside the band, that’s where your tonal balance is drifting. Next to it, a full-track vectorscope plots the entire stereo field as a density map, with correlation and width figures underneath.
5. Check the recommendations. Plain-language notes explain what each reading means and what to do about it, calibrated to the target you selected.
6. Export the report. One click saves every measurement as a text file — useful for archiving, for comparing revisions, or for sending to a collaborator.
Four ways to watch it move
Press Play and the main display becomes a live analyser. The View selector switches between four modes:
- Bars — a classic thin-bar spectrum analyser with peak hold, for reading level across the frequency range at a glance.
- Curve — a filled spectrum curve on a logarithmic frequency axis, closer to how a mastering EQ displays material.
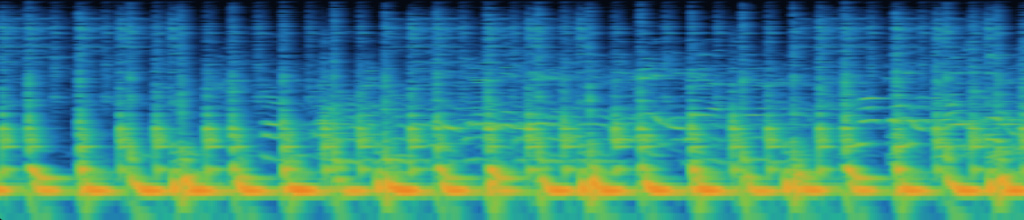
- Spectrogram — a scrolling waterfall showing frequency against time, with intensity mapped from blue through green to orange. This is the view that reveals texture: resonances that ring on, hi-hats that dominate, sub energy that never quite clears.
- Vectorscope — a live goniometer of the stereo field. A vertical shape means mono, a balanced vertical ellipse is a healthy stereo master, and anything spreading horizontally is a phase problem you’ll hear on a club rig.
A Sensitivity slider and a Peak Hold toggle apply across all four.
It will tell you, in about ten seconds, whether your master is ready for the destination you have in mind.
The limits of measurement
Meters are diagnostic tools, not decision-makers. They will tell you that your true peak is over, that your correlation went negative, that your PSR collapsed in the drop. Those are facts worth knowing, and they are much harder to hear than to see.
What meters cannot tell you is whether the record moves anyone. Whether the low end has weight or just volume. Whether the top end is open or brittle. Whether this master serves this piece of music.
That judgement comes from experience, from a monitoring environment you trust, and from having heard thousands of records on systems that do not forgive. The numbers narrow the field. Ears make the call.
Reference at matched loudness, always — level-match your master against a commercial release before you compare, because louder always sounds better for the first few seconds and will fool you every time. Take breaks. Check on monitors, headphones, a phone, a car. If it holds up everywhere, it’s finished.
If you need mastering on a next level and want your compositions to gain a new dimension, contact us.
* Mastering Analyzer is part of the free music tools series on AICreativa.mk: [SR-303 Acid Bassline Synthesizer] and [SR Rhythm Sequencer]